Archive for the ‘Science education’ Category

The effect of graded homework assignments on other grades

Friday, May 4th, 2012

Here’s a comparison I did of the results of using graded homework assignments in a freshman-level chemistry class.  The classes compared all had homework assignments given each week, but only some of them had assignments that were taken up, graded, and counted directly towards the final course grade.

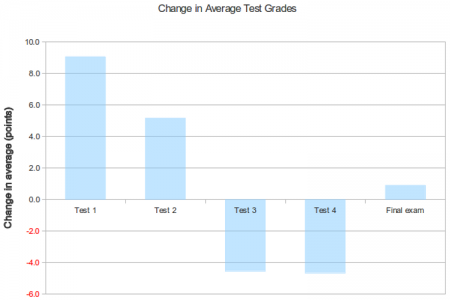
Change in average test scores

As you can see, there was a nearly a letter grade improvement in scores on the first test, compared to classes that didn’t have the graded assignments.  There was an improvement on the second test as well, though it’s much more modest than the improvement on the first test.  So the graded assignments appear to help students start off the course on a better footing than they would have otherwise.

However, the scores for the third and fourth tests are nearly half a letter grade lower than for the classes without the graded assignments.  What’s the cause of this drop in performance?  A few possibilities:

  • Attrition may explain some of the falloff.  Students who started off more poorly in the classes without the graded assignments are more likely to withdraw from the course earlier – leaving a greater percentage of higher-performing students behind for the last two test.  (The latest a student is allowed to withdraw from a course is shortly after the third test.)
  • Student participation in the graded assignments dropped somewhat as the semester progressed.  More students skipped turning in homework before the third and fourth tests compared to the first and second.
  • Students are more likely later in the semester to copy their assignments from other students of from tutors in the school’s tutoring center – depriving them of any benefit they might have gotten from doing the assignment.

For the final exam, the students in the graded assignments classes showed a small improvement over the others.

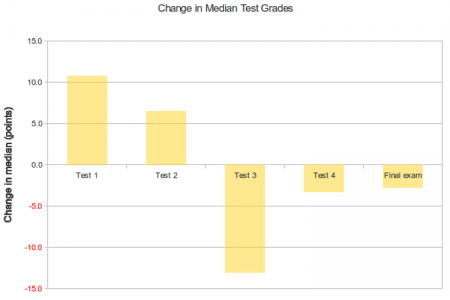
Since these classes are small sections as opposed to large auditorium classes, here’s a look at the median change in test scores for the same set of students.

Change in median test scores

The median scores follow roughly the same trends as the averages do – with better performance on the first two tests and poorer performance on the later tests.  Interestingly, the median final exam scores for the students with graded assignments was slightly lower than the median final exam score for students without the graded assignments.

Happy birthday, Robert Bunsen!

Thursday, March 31st, 2011

If you’ve visited Google today, you might have noticed that their logo looks a little strange.

That’s because it’s the 200th birthday of Robert Bunsen

Born in Gottingen, Germany, on March 31 1811, Robert Wilhelm Eberhard Bunsen was a prominent chemist in his day who discovered the elements caesium and rubidium and developed the Bunsen cell battery.

But he is best remembered for the distinctive gas burner he developed with his laboratory assistant Peter Desaga in 1854 and 1855 to study the colour spectrum of different heated elements.

…. the man behind the Bunsen burner!

Fun with non-Newtonian fluids

Friday, June 19th, 2009

Terra Sig links to a neat demonstration of the properties of non-Newtonial fluids.  Or, more specifically, the properties of shear-thickening fluids – fluids whose viscosity increases when deformed.  Put simply, these are liquids that act more like solids when you try to change their shape too quickly.

The test fluid for the demonstration?  Silly Putty.  Fifty pounds of it.  Dropped off of a building.  Neat, eh?

I do have a suggestion for next year’s demonstration, though.  Drop the fifty pound silly putty block from the building into a large vat of corn starch in water.

Why corn starch and water?  Corn starch/water mixtures are also shear-thickening fluids.

Which shear-thickening fluid would reign supreme?  Tune in next time to find out!

Which shear-thickening fluid would reign supreme? Tune in next time to find out!

It’d be an Iron Chef of non-Newtonian fluids!

Brunswick Stew-pid

Thursday, September 18th, 2008

Looks like our northern neighbor is affected by the same disease that Upstate SC has:

the Brunswick County school board began discussions on teaching creationism alongside evolution – something all four board members present showed a strong interest in. The talk began after Joel Fanti, a parent and graduate of the school system, told the board that he considered it a problem to teach evolution as a fact and that science teachers should include creationism in the curriculum, as well.The audience applauded.

… a case of The Stupid.  At this point, it seems that the state will squash this little Stupid outbreak.  The higher-ups in the NC school system recall the Dover trial.  This, after all, would be a more blatant attempt than the one in Dover to replace science with religion in the science classroom.  A lawsuit would almost certainly follow.

One more disturbing point:

Teachers have alternative assignments for students whose parents have objections about evolution, but students are still assessed on the topic in state tests

Lovely.  Parents can opt their kids out of biology, but teachers are still held responsible for students whose parents won’t allow them to learn?

You keep using that word…

Thursday, June 12th, 2008

“You keep using that word.  I do not think it means what you think it means.”

— Inigo Montoya in The Princess Bride

Via Pharyngula, we learn that the Louisiana House has approved a bill about science teaching.

Supporters say the bill — titled the “Louisiana Science Education Act” — is designed to promote critical thinking, strengthen education and help teachers who are confused about what’s acceptable for science classes.

.. in essence, opening the floodgates to all sorts of religiously and politically motivated bull to be shoveled into science class.  All of this would be done in the name of “critical thinking”.

Could someone please inform lawmakers that filling science class up with nonsense and false controversies is not a good way to promote critical thinking?  Thanks!


So how do we know this is an anti-science bill? Anti-science bills are always obsessed with evolution – an observable fact of nature.  From the bill (SB 733):

The State Board of Elementary and Secondary Education, upon request of a city, parish, or other local public school board, shall allow and assist teachers, principals, and other school administrators to create and foster an environment within public elementary and secondary schools that promotes critical thinking skills, logical analysis, and open and objective discussion of scientific theories being studied including, but not limited to, evolution, the origins of life, global warming, and human cloning.

I’m not the first person to wonder this, but why is it that the atomic theory is never subject to such scrutiny in state legislatures?  It’s certainly harder to see atoms than it is to see evidence for evolution.

Convert-It or Ticket

Tuesday, April 29th, 2008

One thing that most new science students have trouble doing is keeping proper track of units.  Beginning students will write down numbers, assured that they and everyone else will just know what units the number has.

Ten minutes later they’ve forgotten what the units of their numbers were and completely mess up their calculations.

Well, here’s yet another bad thing that can happen when you don’t pay attention to units.

OPP said the U.S. woman’s Mercedes Benz was clocked at a speed of 140 km/h heading west on Highway 401 just before 10:30 p.m. Sunday.

[…]

The total fine amounted to $405.

According to police, the Californian’s explanation for speeding was that the speedometer in her Benz only gave readings in miles per hour and she wasn’t familiar with the metric system.

She was driving in a 100 km/hr zone.  If we’re to believe this woman’s excuse, she saw the “100 km/hr” sign and thought “Whoo!  100!  That means I can drive 100 miles per hour here!  Floor it!

(Now if she really didn’t understand the system, she might have considered using a little common sense.  Her speedometer at the time would have been reading about 87 miles per hour, which is enough to get a ticket most places in the US.)

So here we have a case of mistaken units costing a woman a lot of money.  Something to think about if you’re a new student feeling a little lazy in the lab …

OpenOffice.org 2.4.0

Friday, March 28th, 2008

OpenOffice.org recently released the 2.4.0 version of its free office software. I’m a Linux user, so I’ve used OpenOffice for years on my own machines.

There’s a Windows version, but I’ve always been hesitant about replacing Excel on our lab machines with OpenOffice Calc. Why the hesitation? Excel had one feature that OpenOffice Calc did not. A small feature, but one that saved my students a lot of time.

We don’t have anything in our lab that requires Excel, and our students usually use Excel for simple plotting of calibration curves. Excel could do simple regression analysis on the data and with one or two additional clicks, print a chart that included the regression line and its equation.

OpenOffice.org could print a chart that included a regression line, too. The problem was the equation. To get the equation of the regression line, you had to redo the regression somewhere else in the spreadsheet. If you wanted the equation of the line displayed on the chart, you had to manually type the equation onto the chart as a subtitle. This added a lot of extra steps to what should have been a simple one-click process. I teach chemistry, not computers. Wrestling with software to get it to do something that should be simple is a waste of my time.

That’s finally changed with OpenOffice 2.4.0. it’s now easy to display the equation on a chart, as you can see below.

[Regression line AND equation: OpenOffice 2.4.0]

… so now I should be able to use OpenOffice in my student labs. And if you haven’t looked at OpenOffice for data workup in student labs, check it out. It’s one less piece of software for your school and your students to buy.

Live by the spreadsheet, die by the spreadsheet

Wednesday, March 26th, 2008

There’s a simple relationship that we use quite a bit in analytical chemistry: the relationship between how concentrated a solution is and how much light it absorbs. It’s called Beer’s Law, and in simplified form, it looks something like this:

[A = kc]

… where A = Absorbance (measured by a spectrometer), c = concentration, and k = a constant***. Even if you’re not familiar with Beer’s Law or the instrument it’s used with, you can see that this is a simple linear relationship. If you know the value of the constant k, then you can measure the absorbance of a solution on the spectrometer, then use the equation to find out how concentrated the solution is.

So how do you get the constant? Just make some solutions where you already know the concentration, and measure the absorbance of each one with a spectrometer. The raw data looks something like this.

Test Tube Concentration (M) Absorbance
1 0.0100 0.25
2 0.0150 0.38
3 0.0250 0.63
4 0.0450 1.13
5 0.0600 1.50

Now, what would you do to find that constant, k, that relates the absorbance and the concentration? Here’s a hint – you’ll need to plot the data and perform a linear regression analysis to find out the value of k. This might sound hard, but a modern spreadsheet can make a nice looking plot and perform the linear regression. All you have to do is enter the data, tell the spreadsheet what things to plot, and let the spreadsheet do the grunt work.

Some of my students had to plot absorbance and concentration data as part of a recent laboratory experiment. A depressingly high percentage of these students produced this plot.

[The wrong plot]

Quick! What’s wrong with this plot? (And no fair peeking below to see the answer!)

After making the plot, these students used the value for k that the spreadsheet calculated to find the concentrations of their unknown samples … and failed miserably – reporting concentrations that were several orders of magnitude too high. Impossibly high.

So where did the students go wrong? Their plots should have looked like this.

[The right plot]

Beer’s Law, after all, is a relationship between absorbance and concentration, not between absorbance and the numbers arbitrarily assigned to each test tube for identification! To further the problem, many of these students did not even notice that the concentration numbers they reported were ridiculously wrong.

I’ve been teaching freshman chemistry full-time for more than seven years, and this sort of mistake is much more common now than it was seven years ago.

James Cameron was wrong. The machines will take over eventually, but not via squads of semi-indestructible Schwarzeneggers. They will simply rob us of our ability to think.


*** This constant depends on several things, including the identity of the substance you’re analyzing and the size of the spectrometer’s sample holder.

Why you’ve got to do well in math

Friday, July 27th, 2007

PZ Myers describes a study published in Science correlating courses in high school with success in college-level biology, chemistry, and physics courses. As you might expect, success in college chemistry increases when you take high school chemistry, success in college biology increases when you take high school biology, and success in college physics increases when you take high school physics.

However, a high school course in one science doesn’t translate to better grades in a different science. That’s unfortunate, but didn’t really surprise me. Many high school level science courses cover a lot of topics in a small amount of detail and don’t focus on connections between the sciences or the overall scientific method.

However, there appears to be one high school subject that increases success in all three of the studied college sciences, and that’s … math! This is unsurprising to me. As someone who’s taught freshman chemistry full-time for seven years (has it really been that long?), I’ve noticed that students who are proficient with math almost always succeed in freshman chemistry, and those who really struggle with math rarely succeed. As I’ve said to other teachers:

Give me a student who knows basic math, and I can teach her chemistry. But don’t expect me to teach her basic math and chemistry in one semester.

That said, I think this study isn’t all that useful unless the researchers had some way to control for the effects of self-selection bias on the results. In our state, at least, these high school science and advanced math courses examined are optional, and only students who demonstrate high aptitude in math and science already (which would probably translate to success in college science) and who are on the college prep track take them.

Why the numbers matter

Monday, April 30th, 2007

My introductory chemistry class is geared primarily towards students who are getting their associate’s degree in a medical field – mainly nursing. Because of this, we use drug dosage calculations for math practice when we discuss metric unit conversions.

Some students think I’m harsh when I don’t give credit for botched drug calculations. I, of course, disagree – and Abel Pharmboy’s found a news item that illustrates why:

A pharmacy erroneously made a drug 10 times more potent than intended, which killed three people who received it at an Oregon clinic, the state medical examiner said Friday.

if any of my students are reading this, take note. Stupid math mistakes are sometimes amusing, but never when someone’s life is at stake!